
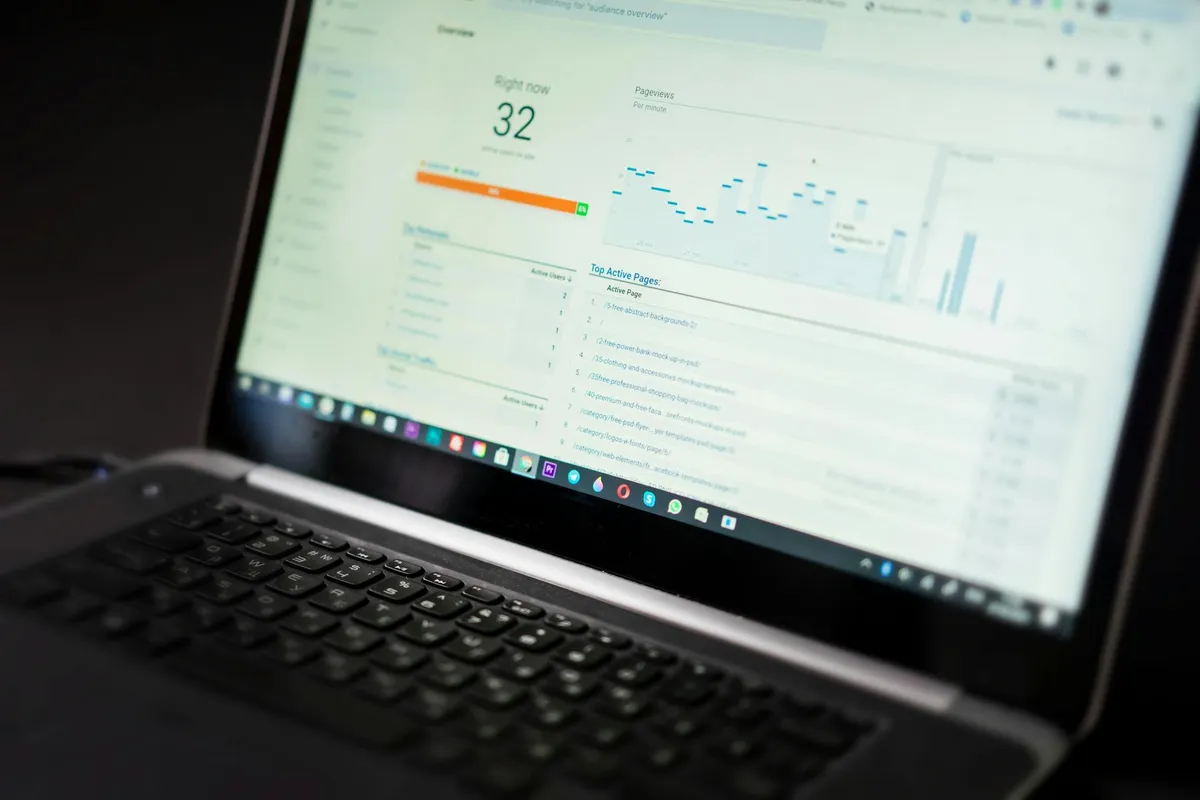
I committed to daily tracking of 200 strategic keywords across a full year. The volume of data revealed patterns about SEO volatility that weekly tracking misses. Here's what I learned.
What the data showed
The 365 days of daily tracking on 200 keywords produced 73,000 data points. Patterns:
Most rankings are stable most of the time. Daily fluctuation of 1-3 positions is normal noise. Tools that report this as significant change produce false alarms.
Major movement happens during specific events. Algorithm updates, content updates on the page, backlink changes, technical issues — these produce real movement. Most other days are noise.
Position 1-3 is more stable than position 7-15. Top rankings hold; mid-page rankings move more.
Long-tail keywords are more volatile than short-tail. The lower search volume produces more variability in measurement.
Mobile vs. desktop ranks often diverge significantly. Tools that report only one mask important variation.
What I now do
Based on the data:
- Daily tracking only for the most-strategic keywords (top 20-50)
- Weekly tracking for the broader strategic set (50-200)
- Alert systems for movement beyond normal noise (5+ positions)
- Mobile and desktop tracked separately
- Investigation of major movement when it occurs (don't investigate noise)
This approach produces actionable data without the noise that comprehensive daily tracking produces.
The takeaway
SEO volatility is real but mostly noise. Tracking strategies that distinguish signal from noise produce useful data; strategies that treat all movement as significant produce false alarms.
For your own tracking, calibrate your alerts to actual movement patterns. The data above suggests where the thresholds should be.